Amdahl's Law: TypeScript 7 is 10x faster. Your CI is still slow
🇧🇷 Leia em Português
Your application’s CI keeps getting slower over time. A little more every month, until the day it stops being an annoyance and turns into a blocker.
What’s your first move?
I watched this happen last week.
A Node + TypeScript service had a 15-minute CI. Unit tests with coverage, around 1,200 of them.
And the reasoning that shows up in the moment is always the same: if it’s slow, something is wrong, so it must be possible to optimize. Upgrade TypeScript to the Go version, which typechecks much faster. Swap eslint and prettier for ox, which are much faster.
None of that is false. TypeScript in Go is absurdly faster. Oxlint is faster than eslint.
And it still wasn’t going to fix anything.
TypeScript 7 really is that fast
The tsc you know was a TypeScript compiler written in TypeScript, running on Node. Version 7 is a faithful port of it to Go, shipped as a native binary, with type-checking parallelized across 4 threads.
Microsoft’s numbers are not modest: VS Code went from 125.7s to 10.6s, Sentry from 139.8s to 15.7s. In the editor, opening a file with errors dropped from ~17.5s to under 1.3s.
The emitted JavaScript is the same. The type system is the same. This is a compile-time story, full stop.
One detail if you plan to migrate: 7.0 has no programmatic API, and it only arrives in 7.1. Any tool that embeds the compiler - typescript-eslint, Volar, and by extension Vue, Svelte, Astro, Angular - stays on TypeScript 6.
The Japanese knife and the pot of beans
Amdahl’s Law explains why swapping the compiler was never going to move the needle:
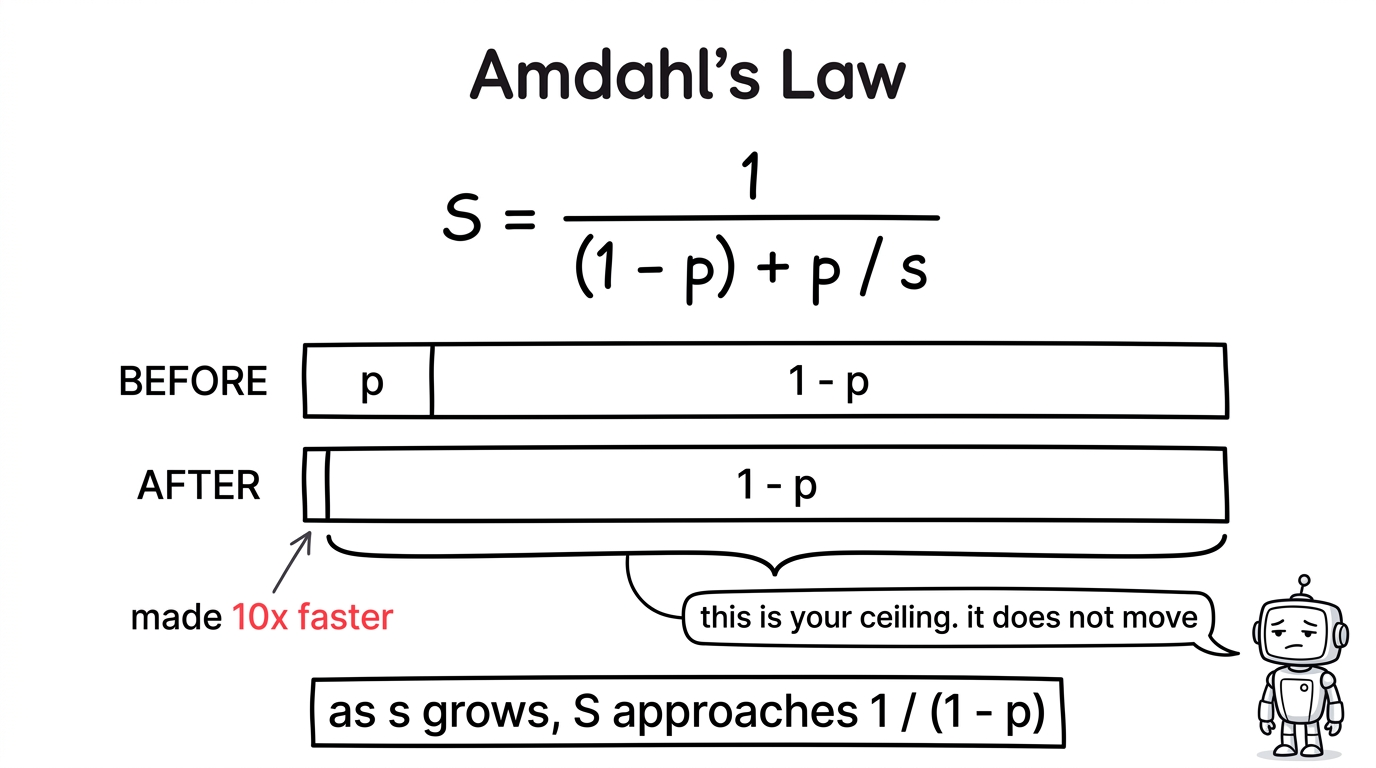
p is the fraction of the work you improved, s is how much you improved it. The painful part is the limit: as s approaches infinity, the maximum speedup of the whole system becomes 1 / (1 - p).
In other words: the part you didn’t optimize is your ceiling. And it doesn’t move.
Think about Sunday lunch. It takes you 40 minutes. You buy an expensive Japanese knife that chops onions 10x faster, and the marketing wasn’t lying. Except chopping onions took 2 minutes, and now it takes 12 seconds.
Lunch still takes a little over 38 minutes.
Because what takes time is the pot of beans on the stove. And beans are not a chopping problem, they are a waiting problem. No knife solves waiting.
They did the upgrade
Everything went up at once: eslint 8.57 -> oxlint 1.76, prettier 3.0 -> oxfmt 0.61, TypeScript 5.9 -> TypeScript 7.
| step | before | after |
|---|---|---|
lint |
5.56s | 3.73s |
format:check |
6.51s | 3.42s |
typecheck |
4.46s | 4.04s |
typecheck for tests |
4.50s | 3.93s |
| total | 21.03s | 15.12s |
The new engines delivered the promised 6x to 10x. tsc 7 compiles the entire project in 1.22s. What eats the difference is the fixed overhead of each invocation: spinning up the process and loading the tool costs more than the actual work.
Net result: 5.91 seconds. Out of 900.
And note that those four steps together were 21s in a 900s pipeline, which puts p at 2.3%. If the tools were infinitely fast, zero cost:
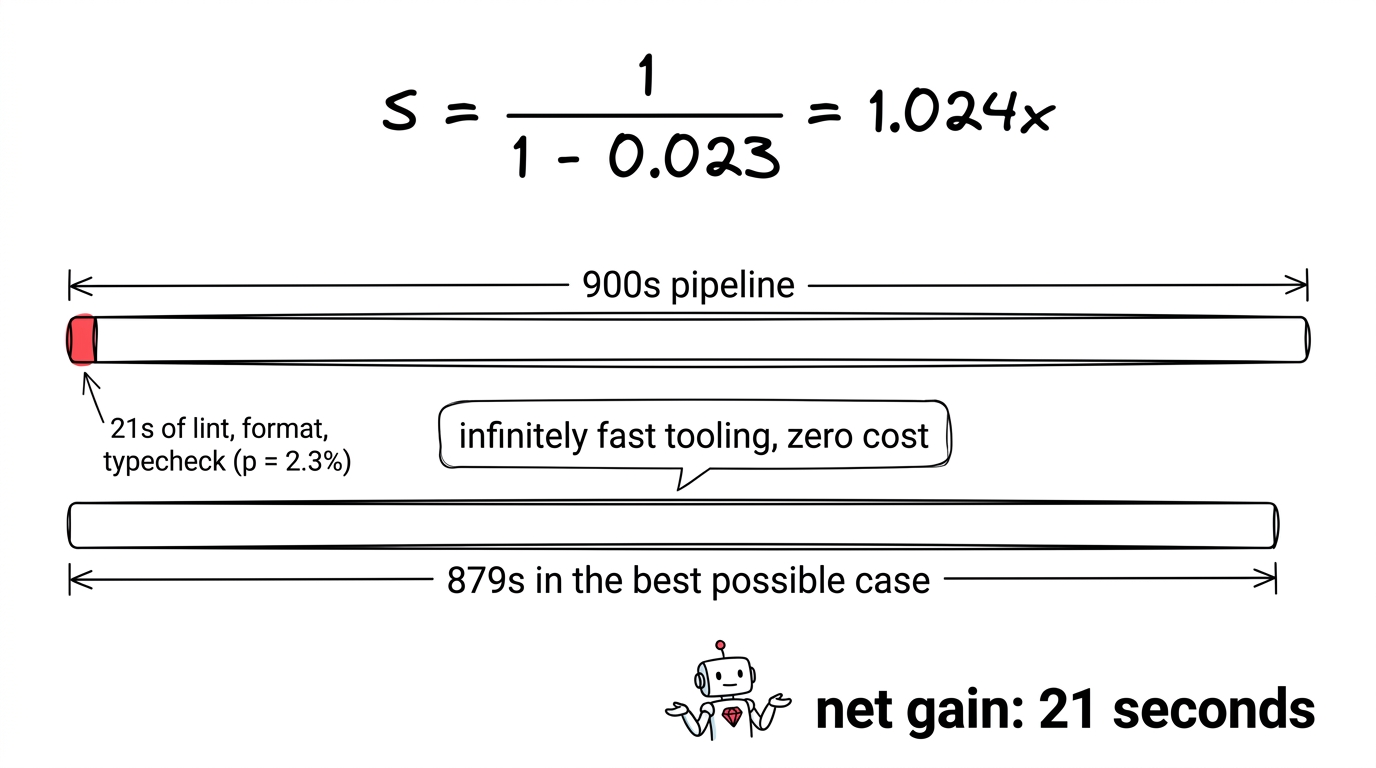
In the impossible scenario, CI drops from 15m00s to 14m39s. That was the ceiling, and it was available before a single line of code was written, from one thirty-second division.
Microsoft’s numbers aren’t a lie, either. Slack cut CI type-checking from 7.5 minutes to 1.25 minutes, but there it’s a dedicated tsc step, where the compiler is 100% of the work. Same compiler, same engine gain, opposite outcome: the difference isn’t in the tool, it’s in the denominator.
Measuring costs five minutes
GitHub Actions already shows the duration of every step in the UI, for free. Open the last run and read it before forming any theory. Then divide the step’s time by the total: that is the maximum you can gain by attacking it. If it comes out to 2%, you just saved yourself a week.
If you need to dig deeper, the tools already exist and are criminally underused:
jest --verbosegives you the duration per file. Three files usually account for half the time.jest --detectOpenHandlesfinds promises that never resolve and timers that never clear, which leave the runner sitting around waiting for the event loop to drain after the tests already finished. It has existed for years.
Knuth wrote this in 1974, on the same page of Structured Programming with go to Statements that gave us the “premature optimization is the root of all evil” everyone quotes at half length:
“It is often a mistake to make a priori judgments about what parts of a program are really critical, since the universal experience of programmers who have been using measurement tools has been that their intuitive guesses fail.”
The problem is the jump
None of this means “don’t upgrade.” Do upgrade - TypeScript 7 is an impressive piece of engineering and I plan to migrate everything I can. Those 6 seconds don’t move CI, but they do move the agent loop, which runs typecheck and lint dozens of times an hour. That is a real gain, just in a different number.
What’s wrong is something else: going from “it’s slow” straight to “swap it for something faster,” without the thirty-second division in between. Tool speed is not system speed.
And swapping tools is comfortable because it looks productive: there’s a PR, there’s a changelog, there’s a nice benchmark to show. Measuring first looks like bureaucracy.
But measuring is what separates engineering from cheering.
Thanks for reading!
- Announcing TypeScript 7.0 - the official announcement, with the benchmarks and the full list of breaking changes.
- TypeScript 7 Went Native: What Actually Changes and What Doesn’t - a good read on what the migration does not change.
- Systems Performance, by Brendan Gregg. If you only read one chapter, read chapter 2.